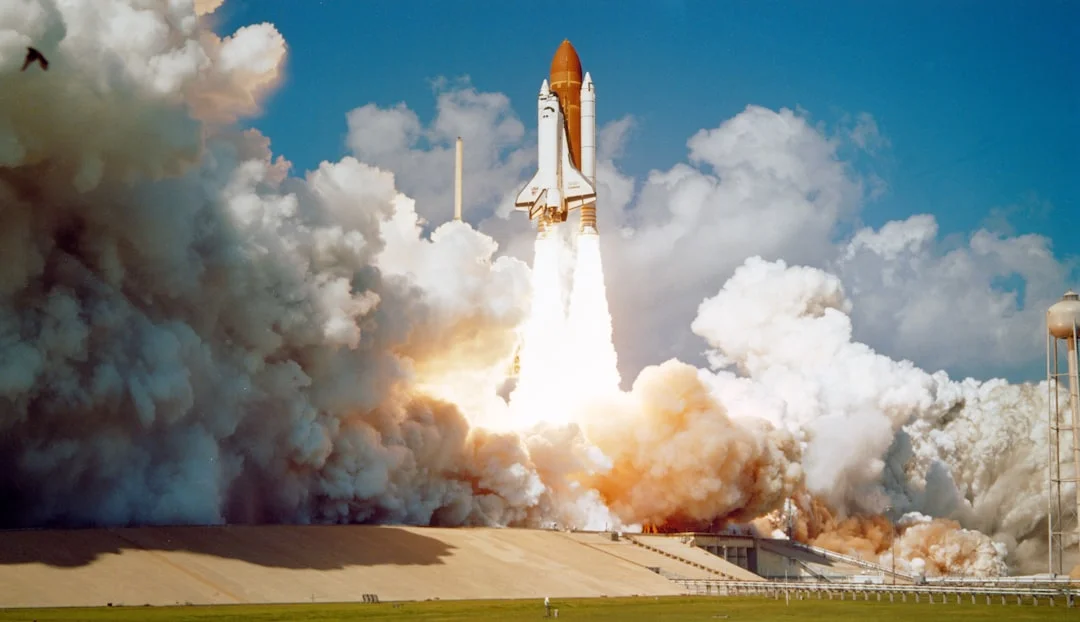
Space Missions Slide Deck Design: a Practical Guide
A practical guide to space missions slide deck design, with steps, visuals, and best practices for briefing audiences.
Space missions slide deck design is a specialized craft. It sits at the intersection of rigorous data, precise visuals, and clear storytelling. In mission planning and briefing contexts, a deck must translate complex orbital mechanics, telemetry dashboards, and trajectory analyses into a concise narrative that stakeholders can grasp quickly. The goal is not to overwhelm audiences with every data point but to illuminate the story behind the numbers: where the mission is in its timeline, what risks matter most, and what decisions are required next. Modern space programs—from NASA and ESA to commercial constellations—rely on visuals and dashboards that communicate both the science and the strategy behind a mission. This guide provides a comprehensive, actionable approach to space missions slide deck design, grounded in current industry practices and data-driven insights. It draws on established guidelines for display design, best practices from leading engineering and visualization communities, and real-world instruments used in mission analysis and briefing.
Recent industry developments underscore why this topic matters today. The global space economy is on a growth trajectory, with multiple sources noting substantial activity in 2025 and beyond as satellite constellations mature and new missions advance from study to deployment. For example, industry analyses place the 2025 space economy around the mid- to upper-hundreds of billions of dollars, with space-enabled applications driving a significant portion of that value and the underlying infrastructure continuing to scale. These dynamics create a strong incentive to present mission data in a way that supports timely, evidence-based decision-making. In practice, this means investing in slide deck design that can succinctly convey complex trajectories, telemetry states, and risk signals to executives, funding partners, and cross-disciplinary teams. (nova.space)
Opening
A well-crafted deck for space missions slide deck design serves as a bridge between analytical rigor and executive clarity. The most effective slides distill months or years of planning into a narrative that highlights the mission’s objective, the critical paths, and the decision points that determine success or reader comprehension. In today’s environment, stakeholders expect visuals—the orbit maps, the telemetry readouts, the timelines—that illuminate the path from concept to operations. This guide helps engineers, mission planners, and presentation teams build a repeatable, data-driven workflow that yields consistent, accessible decks suitable for technical audiences and leadership alike. Readers will learn how to set up the right prerequisites, execute a step-by-step design process, troubleshoot common issues, and plan for advanced techniques and next steps. The guide emphasizes practical, actionable steps and acknowledges that the approach should adapt to different missions, data sources, and briefing contexts.
As you work through this guide, you’ll see references to real-world tools and standards used in space mission visualization and display design. For example, NASA’s display standards emphasize limiting the amount of information presented at any one time, aligning layout with task flow, and avoiding unnecessary scrolling to preserve cognitive workflow during operation and briefing. MIT’s AeroAstro and NASA tools offer evidence-based practices for slide design, including how to structure messages, use visual hierarchy, and minimize distractions. In parallel, ESA’s AMAT and NASA’s Open MCT illustrate how mission analysis and telemetry visualization evolve from planning into operational decision-support environments. These sources provide a foundation you can adapt to your own space missions slide deck design workflow. (nasa.gov)
Prerequisites & Setup
Required Tools
- Presentation software: A capability to build and prototype slides quickly (PowerPoint, Google Slides, or ChatSlide as a production environment). Industry guidance from MIT’s slide design resources emphasizes the value of a clean, consistent toolset that supports visual clarity, not just “more features.” Practical templates reduce friction and help teams scale deck production. (mitcommlab.mit.edu)
- Visuals and data tools: Access to trajectory visualizations, telemetry-like dashboards, and orbital diagrams. NASA’s AMMOS and Open MCT platforms demonstrate how mission data can be visualized in interactive environments, which you can adapt to slide-ready visuals or static imagery for briefing decks. (ammos.nasa.gov)
- Data sources with credibility: Authoritative mission data from space agencies or mission design tools (e.g., AMAT, MDNav, or other mission design suites). ESA’s AMAT documentation highlights the importance of uniform data formats and reusable visualization components to foster collaboration across teams. (esa.int)
Core Concepts & Skills
- Visual storytelling for technical audiences: The MIT slide design guidance emphasizes creating slides that supplement the talk, not replace it; each slide should convey a single main message with a clean visual hierarchy. This approach directly informs how you compose space mission slides—prioritize clear, interpretable visuals over dense text. (mitcommlab.mit.edu)
- Display and readability standards: NASA’s display standard urges limiting information per display, aligning content with task flow, and providing consistent layout across related displays. While not every deck is a cockpit display, these principles scale to briefing slides where clarity and consistency reduce cognitive load. (nasa.gov)
- Data visualization practices: Nature’s data visualization guidance and MIT’s resources emphasize minimizing distractions, maximizing legibility, and using appropriate color and typography—principles that matter when you’re translating orbital mechanics and telemetry into slide visuals. (mitcommlab.mit.edu)
Access & Data Sources
- Open telemetry and mission visualization: Use Open MCT or similar platforms to understand how telemetry and mission data are organized and displayed in real-time contexts; you can translate representative visuals into slide-ready formats. (ammos.nasa.gov)
- Mission analysis and trajectory visualization: ESA’s AMAT and related tools provide a blueprint for modular, reusable visualization approaches that can be adapted into slide templates for consistent briefing visuals. (esa.int)
Kickstart Space Missions Slide Deck Design with ChatSlide
Turn data-rich telemetry and trajectory visuals into polished slides quickly.
Sign Up →
Step-by-Step Instructions
Step 1: Define briefing objective and audience
Photo by Marija Zaric on Unsplash
What to do
- Clarify the mission’s briefing objective and success criteria. Identify the audience (e.g., program leadership, mission controllers, funding partners) and determine the level of technical detail appropriate for each group.
- Create a one-paragraph brief that states the mission’s purpose, current status, key risks, and the decisions you expect the audience to make during or after the briefing.
Why it matters
- A well-defined objective guides every visual choice, slide order, and data selection. It reduces scope creep and ensures that the deck aligns with the mission’s timeline and decision points. Clear alignment with the audience minimizes misinterpretation of complex data.
Expected outcome
- A documented briefing objective, audience map, and a draft slide plan (rough outline) that maps to the decision milestones.
Common pitfalls to avoid
- Failing to align with executive-level decision points or assuming all technical details are equally important to every audience.
- Overloading a single slide with text or data, or under-clarifying the goal of the briefing.
Citations and supporting practices
- Best-practice guidance from MIT emphasizes defining the main message per slide and controlling visual hierarchy to guide the audience’s attention. Use this approach to shape your Step 1 objective and first slide sequence. (mitcommlab.mit.edu)
- NASA display guidance advises a task-oriented content approach, avoiding unnecessary scrolling and ensuring the deck supports the briefing’s objectives. Apply these principles when translating the objective into a deck structure. (nasa.gov)
Streamline Step-by-Step Space Deck Creation
Build and iterate orbit diagrams and mission timelines with guided templates.
Start Now →
Step 2: Gather and structure data
What to do
- Inventory data sources: trajectory data, telemetry states, mission timelines, risk flags, and contact narratives. Create a data dictionary describing units, timestamps, data freshness, and relevant thresholds.
- Validate data provenance: prefer primary or authoritative sources (NASA/ESA/fields using AMAT or MDNav, etc.). Document data quality flags and any assumptions used to transform data for slides.
Why it matters
- Space mission visuals are only as credible as their data. Establishing data provenance and quality controls ensures your visuals match briefing expectations and reduce the risk of misinterpretation.
Expected outcome
- A structured data package with source names, data formats, and an export plan for slide-ready visuals (images, charts, and annotated diagrams).
Common pitfalls to avoid
- Relying on hand-edited data (risking transcription errors). Always re-verify values against trusted sources.
- Missing metadata (e.g., units, time references) that makes a slide hard to interpret.
Citations and supporting practices
- ESA’s AMAT emphasizes uniform formats and reusable design patterns to support collaboration across teams; applying this mindset helps unify data used in slides. (esa.int)
- NASA’s Open MCT and related visualization tools demonstrate how to structure mission data for effective visualization, which you can mirror in slide visuals. (ammos.nasa.gov)
Take Your Space Deck to the Next Level
Centralize data sources and create consistent visuals for every slide.
Sign Up →
Step 3: Create a visual language kit
What to do
- Establish a space-themed yet accessible visual language: define color palettes that accommodate color-blind viewers, choose legible typefaces, and set grid-based layouts to ensure consistency across slides.
- Build a small library of reusable visuals: orbit diagrams, trajectory plots, telemetry readouts, timeline blocks, and badge-like status indicators.
- Draft slide templates (title slide, data slide, timeline, and 3D-orbit slide) to speed production and ensure consistency.
Why it matters
- A consistent visual language reduces cognitive load, helps audiences recognize patterns across slides, and strengthens the narrative flow. It also accelerates production when multiple team members contribute.
Expected outcome
- A documented visual language kit (colors, fonts, iconography) and 3–5 slide templates ready for data insertion.
Common pitfalls to avoid
- Overly complex color schemes that reduce readability; avoid more than two or three primary colors for the deck.
- Inconsistent typography or misaligned grids that make slides feel amateurish.
Citations and supporting practices
- MIT’s slide design guidance covers visual hierarchy, color use, and simplification to improve comprehension, which informs how to select palette and typography for space visuals. (mitcommlab.mit.edu)
- The NASA Appendix F display guidance calls for grouping related elements and consistent title regions, reinforcing how a visual language kit should anchor slide structure. (nasa.gov)
Step 4: Build space-friendly slide templates
What to do
- Create templates tailored to space visuals: orbit maps with clear axes and legends, trajectory schematics with labeled launch windows, telemetry dashboards with compact readouts, and mission phase timelines.
- Include placeholders for data labels, units, and uncertainties. Ensure slide titles reflect a single main message.
- Prepare visuals that accommodate both static printouts and editable digital formats, with scalable vector graphics where possible.
Why it matters
- Space visuals often require precise labeling and consistent scales to communicate accurately. Templates ensure you present the same type of information in uniform ways across slides and across briefing iterations.
Expected outcome
- A library of 3–5 templates ready for data insertion, plus style constraints to maintain consistency across the deck.
Common pitfalls to avoid
- Templates with inconsistent axis scales or poorly labeled legends that confuse rather than clarify.
- Overdesigning templates with too many animation cues that distract from the narrative.
Citations and supporting practices
- MIT’s Best Practices section emphasizes identifying a main message per slide and controlling visual hierarchy, which is essential when designing orbit and telemetry slides. (mitcommlab.mit.edu)
- NASA’s display guidance suggests ensuring content is legible and grouped logically; templates should reflect this organization. (nasa.gov)
Step 5: Craft the narrative and slide sequence
What to do
- Outline the deck’s narrative arc: context, mission design rationale, key trajectories and milestones, risk overview, decision points, and next steps.
- Map each slide to a single narrative beat: a bold slide title, a visual that supports the beat, and a short data-backed point or takeaway.
- Integrate visuals that mirror real briefing language: orbit diagrams to show phases, telemetry readouts to reflect readiness or anomalies, and timelines to denote critical path items.
Why it matters
- A clear narrative helps executives and engineers alike connect data to decisions. It also makes it easier to rehearse and refine the briefing for time-constrained sessions.
Expected outcome
- A slide-by-slide outline with defined main messages, visuals, data points, and a pacing plan for a typical briefing session (e.g., 20–25 minutes).
Common pitfalls to avoid
- Overloading slides with multiple messages or failing to connect data points to the narrative.
- Inconsistent terminology across slides that confuses the audience.
Citations and supporting practices
- MIT’s emphasis on “one main message per slide” (5.1) is especially relevant here to ensure each slide’s purpose remains focused. (mitcommlab.mit.edu)
- The NASA display guidance reinforces grouping related information and maintaining a consistent title region to support a cohesive narrative. (nasa.gov)
Step 6: Build visuals and assemble the deck
What to do
- Populate templates with vetted visuals: orbit diagrams (2D or 3D projections), trajectory plots, and telemetry-style readouts that convey current status and thresholds.
- Consider lightweight 3D visuals: WebGL-based orbit models or simplified globe visualizations can be embedded as static or animated elements to convey spatial relationships. If interactivity is not possible in the final deck, provide high-quality stills or pre-rendered animations to illustrate motion.
- Add captions and annotations to clarify data points, thresholds, and uncertainties. Ensure units and reference frames are clearly stated.
Why it matters
- The moment of truth for a slide deck is how effectively it communicates, not only what it contains. Clear visuals with concise annotations improve comprehension and reduce the risk of misinterpretation during a briefing.
Expected outcome
- A ready-to-deliver slide deck with 8–14 slides (typical for a focused briefing), plus backup visuals and a short briefing script to accompany the slides.
Common pitfalls to avoid
- Using overly dense visuals or tiny text that becomes illegible from the back of a room.
- Inconsistent scales, units, or color mappings across slides.
Citations and supporting practices
- The MIT slide design guidance underscores the importance of clear visuals, legibility, and minimalism to support the presenter’s message. (mitcommlab.mit.edu)
- NASA’s display standards emphasize consistent grouping and a dedicated, visible area for key information, which you should reflect in final slide assembly. (nasa.gov)
Step 7: Review, rehearse, and iterate
What to do
- Run a mock briefing with colleagues who represent various expertise (engineers, program managers, marketing/communications). Capture feedback on clarity, pacing, and the effectiveness of visuals.
- Iterate on visuals and wording: refine titles, simplify axes, adjust color contrasts, and tighten any long captions or data labels.
- Prepare a concise executive summary slide and a longer technical annex, if needed, so the deck can be adapted for different audiences.
Why it matters
- Iterative feedback ensures the deck remains accurate, accessible, and persuasive across different briefing contexts. It also helps identify potential misinterpretations before presenting to a live audience.
Expected outcome
- A finalized deck that has undergone at least one round of internal review, with actionable feedback implemented and a plan for future updates.
Common pitfalls to avoid
- Relying on a single reviewer; gather input from multiple stakeholders to cover different viewpoints.
- Skipping rehearsals, which can lead to timing issues or missing transitions between sections.
Citations and supporting practices
- The MIT guidance on the value of slides supplementing the presentation (not replacing it) reinforces the importance of rehearsal-focused refinement and alignment with the presenter’s script. (mitcommlab.mit.edu)
Troubleshooting & Tips
Common issues with space visuals
- Issue: Densely labeled orbit plots make slides hard to read from the back of the room.
- Solution: Simplify labels, use larger font for key data points, and provide a secondary slide with a high-level overview. Refer to MIT’s Best Practices (Identify main message, visual hierarchy) to guide simplification. (mitcommlab.mit.edu)
- Issue: Telemetry numbers appear inconsistent across slides due to unit conversions.
- Solution: Maintain a single data dictionary with unit standards and reference frames. NASA’s display guidelines emphasize consistent units and fixed widths for numeric fields to prevent misinterpretation. (nasa.gov)
Pro tips for readability and impact
- Visual hierarchy matters: Use typographic scale to guide readers, with the most important data in prominent positions. MIT’s material emphasizes this approach as a core principle. (mitcommlab.mit.edu)
- Use color intentionally: Choose a limited palette with high contrast to ensure legibility for color-blind readers; Nature’s visualization guidance supports accessible color strategies. (mitcommlab.mit.edu)
- Align visuals with mission storytelling: Structure slides so visuals mirror the mission’s phases or decision points; NASA’s display standards advocate a logical content flow that minimizes cognitive load. (nasa.gov)
Accessibility & optimization
- Ensure slide content remains accessible to all readers, including those with visual or cognitive differences. The MIT resources and Nature guidance emphasize accessibility as a part of good design. (mitcommlab.mit.edu)
- Keep file sizes reasonable for quick sharing and offline viewing. When using high-resolution diagrams, consider exporting optimized PNG/SVGs and using compressed video only where essential.
Next Steps
Advanced techniques

Photo by NASA Hubble Space Telescope on Unsplash
- Dynamic, data-driven slides: Consider building live-linked visuals that can be updated with new telemetry states or mission phase changes for post-briefing edits and recurring reviews. NASA’s Open MCT demonstrates how dashboards can reflect real-time or near-real-time data, which you can emulate in slide-ready formats for ongoing briefings. (ammos.nasa.gov)
- 3D trajectory storytelling: For more advanced briefings, incorporate 3D orbit visualizations or globe-based trajectory animations that illustrate spatial relationships across time. Academic and industry work on spacecraft trajectory visualization highlights how to present high-dimensional data in an intuitive, legible way. When used judiciously, 3D visuals can be compelling story accelerants rather than distractions. (datavis.caltech.edu)
Related resources and communities
- AMAT and MDNav ecosystems: ESA’s AMAT provides a modern, modular framework for mission analysis and trajectory design; accessibility to collaborators is improved through standardized interfaces and data formats. This ecosystem can inspire template architectures for your slide deck assets and data pipelines. (esa.int)
- Industry context for space data storytelling: Industry analyses on the growth of the space economy and the role of satellite services and applications provide a broader narrative backdrop for briefing slides. While you should rely on your mission data for specifics, understanding market dynamics can enrich your storytelling and help justify certain decisions in a briefing. (nova.space)
Closing
Designing space missions slide deck design that is both data-rich and briefing-ready requires a disciplined workflow, a practical visual language, and a clear narrative arc. By starting with well-defined objectives, assembling credible data, establishing a reusable visual language, building mission-specific templates, and iterating through rehearsals, you can produce decks that illuminate the most important aspects of a mission while remaining accessible to diverse audiences. The process aligns with established standards and best practices from NASA, MIT, and ESA—principles that emphasize clarity, consistency, and audience-appropriate storytelling. As you apply these steps, you’ll find that the right visuals—orbit diagrams, telemetry dashboards, trajectory timelines—become powerful complements to your briefing, not distractions from it. The space missions slide deck design method outlined here is designed to scale—from small internal reviews to large, cross-agency briefings—while remaining flexible enough to accommodate evolving mission data and new visualization tools.
If you’re ready to put these principles into action, begin by defining your briefing objective and assembling your data sources, then leverage the templates and templates-driven workflows to accelerate production. The industry context suggests a robust demand for effective, data-driven briefings as space programs expand and the space economy continues to mature. Use this guide as a practical compass to navigate that landscape, delivering clear, credible, and compelling space mission briefings every time.
Author
2026/07/19