Quick Answer: ChatSlide.ai generates a complete QBR presentation from your Excel data, KPIs, or reports in 2 minutes — including executive summary, performance charts, customer insights, and next-quarter goals. Trusted by GE, GovCIO, and 180,000+ professionals.
The Quarterly Grind: Why QBRs Drain Your Team
Every quarter, the same ritual unfolds across thousands of organizations. Sales managers, account executives, operations leads, and department heads spend hours — sometimes days — assembling the same type of presentation they built three months ago.
The time adds up fast:
- The average manager spends 8-12 hours preparing a single quarterly business review presentation
- Teams with multiple stakeholders often spend 20+ collective hours per QBR cycle on deck creation
- Most QBR presentations reuse the same structure quarter after quarter, yet teams rebuild them from scratch
- Client-facing QBRs in SaaS and professional services can number 10-50 per quarter for a single account manager
The irony is hard to miss. QBRs are designed to communicate business performance efficiently, yet the process of creating them is anything but efficient. You pull data from Salesforce, HubSpot, Google Analytics, or internal dashboards. You copy numbers into slides. You manually build charts. You format, align, and resize. Then you do it all again next quarter.
If you are looking for a way to create a QBR deck from data automatically, or need a quarterly business review template that populates with real metrics, AI presentation tools have matured to the point where this cycle can be broken. This guide walks through how to build effective QBR presentations using AI — specifically with ChatSlide — while keeping the strategic thinking where it belongs: with you.
What Makes an Effective QBR Presentation
Before automating anything, it helps to understand what separates a good QBR from a forgettable one. The best quarterly business reviews share a consistent structure that balances retrospective analysis with forward-looking action.
1. Executive Summary (1-2 slides)
Open with the headline. Did you hit your targets? What is the single most important takeaway? Senior stakeholders often only read the first two slides, so front-load the insight.
2. KPI Dashboard (2-3 slides)
Present your key performance indicators with clear visual comparisons to the previous quarter and to targets. Use charts that show trends, not just snapshots. A revenue number means little without context — show the trajectory.
3. Wins and Highlights (2-4 slides)
Celebrate what worked. In client-facing QBRs, this is where you demonstrate value delivered. In internal reviews, this is where you reinforce what the team should keep doing. Be specific: name the initiative, quantify the impact, credit the people involved.
4. Challenges and Risks (2-3 slides)
Address what did not go well — honestly. The credibility of your entire QBR depends on this section. Flag risks early, propose mitigations, and distinguish between controllable and external factors.
5. Deep Dives (3-5 slides)
Pick one or two topics that warrant deeper analysis. This could be a product adoption trend, a churn cohort analysis, a competitive landscape shift, or a campaign performance breakdown. This is where your QBR stops being a status report and starts being a strategic conversation.
6. Action Items and Next Quarter Goals (2-3 slides)
Every QBR should end with clear, accountable next steps. Who owns what? What are the measurable goals for Q+1? What resources are needed? Without this section, a QBR is just a retrospective with no teeth.
7. Appendix (optional)
Detailed data tables, methodology notes, and supporting evidence for anyone who wants to dig deeper.
A well-structured QBR typically runs 15-25 slides. Anything longer risks losing your audience. Anything shorter may lack the depth needed for meaningful discussion.
Step-by-Step: Building a QBR Presentation with ChatSlide
Here is how to go from a blank screen to a polished quarterly business review deck using AI, without sacrificing the strategic substance that makes QBRs valuable.
Step 1: Describe Your Business Context
Start by telling ChatSlide what kind of QBR you are building. The more context you provide, the better the AI tailors the output.
You can use the text input mode to describe your situation:
"Q4 2025 quarterly business review for our B2B SaaS company. We serve mid-market HR departments. Key metrics: ARR grew 18% to $4.2M, net revenue retention was 112%, we onboarded 34 new customers, churn was 3.1% (up from 2.4% last quarter). Major win: launched self-serve onboarding that reduced implementation time by 40%. Challenge: enterprise deal cycle lengthened by 22 days."
Alternatively, you can upload existing documents — last quarter's QBR deck, a strategy document, or meeting notes — as reference material. ChatSlide supports PDF, Word, and PowerPoint uploads, so you can build on what you already have rather than starting from zero.
Step 2: AI Generates Your QBR Outline
Based on your input, ChatSlide generates a structured outline following QBR best practices. The AI understands the difference between a client-facing QBR (where you are demonstrating ROI to a customer) and an internal operations review (where you are reporting to leadership).
Review the outline and adjust it. Add sections you need, remove ones you do not. Reorder slides to match your narrative flow. This is where your strategic judgment shapes the deck — the AI handles structure, you handle story.
Step 3: Customize with Your Data
This is where most QBR workflows break down with generic presentation tools. You have real numbers, and you need them in the deck accurately.
With ChatSlide, you can refine each slide using 19 AI editing tools. Add your actual metrics, adjust talking points, and ensure every claim is backed by data. The AI helps you write concise, executive-friendly language — turning raw data points into insight statements.
For example, instead of a slide that says "Revenue: $4.2M," the AI helps you frame it as "ARR reached $4.2M, representing 18% YoY growth and exceeding our Q4 target by $200K."
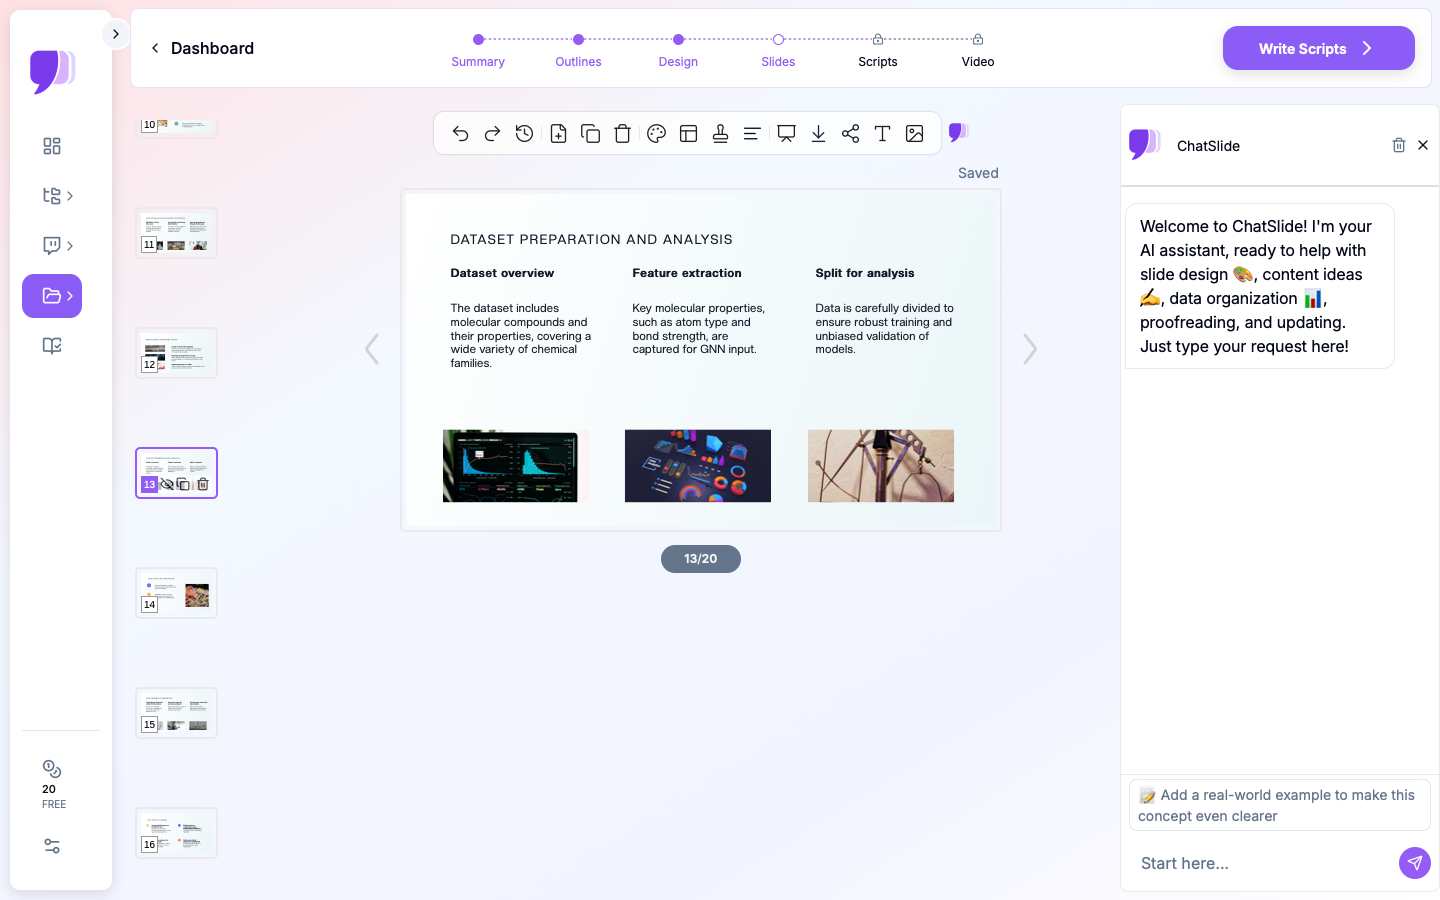
Step 4: AI Chart Generation from Real Data
This is the capability that matters most for QBR presentations. ChatSlide generates real, data-driven charts — not decorative placeholders.
You can provide data through multiple channels:
- Upload Excel or CSV files with your quarterly metrics, and ChatSlide generates appropriate visualizations — line charts for trends, bar charts for comparisons, pie charts for breakdowns
- Reference data in your uploaded documents, and the AI extracts and visualizes it automatically
- Describe data verbally, and the AI creates accurate charts from your description
- Let AI search for benchmark data to add industry context to your internal numbers
The charts are rendered as clean, professional visualizations that look native to corporate slide decks. No more screenshotting dashboards and pasting them as blurry images.
Step 5: Design Template Selection
Choose a design template that matches your brand or presentation context. For internal QBRs, clean and minimal works best — the data should be the focus, not the design. For client-facing QBRs, select a template that reflects professionalism and aligns with your company's visual identity.
ChatSlide offers multiple professional templates designed for business presentations, so your QBR looks polished without requiring design skills.
Step 6: Export to PowerPoint
Corporate environments run on PowerPoint. Your QBR will likely be shared via email, presented in a conference room running Windows, or uploaded to SharePoint. ChatSlide exports directly to .pptx format, ensuring full compatibility with Microsoft 365 environments.
The exported file is fully editable — your team can make last-minute adjustments, your manager can add a slide, and your client can extract charts for their own internal reporting.
Leveraging ChatSlide's Knowledge Base for Recurring QBRs
One of the most powerful features for QBR workflows is ChatSlide's knowledge base. Since QBRs are inherently recurring, you can store past QBR data, templates, and company context in your knowledge base. This means:
- Quarter-over-quarter consistency: The AI remembers your KPI definitions, your reporting structure, and your preferred slide format
- Faster iteration: Each quarter, you update the numbers rather than rebuilding the narrative
- Institutional memory: New team members can generate QBR decks that match the team's established format
- Cross-quarter comparisons: The AI can reference previous quarters' data when generating trend analyses
Upload your company's QBR template, your brand guidelines, and your historical performance data. The AI uses this context to generate QBR decks that feel like they were built by someone who has been on your team for years.
Tips for QBR Presentations That Drive Action
Even with AI handling the heavy lifting, the strategic quality of your QBR depends on how you approach it. Here are principles that separate effective QBRs from slide-reading exercises.
Lead with Insights, Not Data
Your audience can read a spreadsheet. What they cannot do easily is extract meaning from it. Every slide should answer "so what?" before it shows "what." Start with the insight, then support it with data — not the other way around.
Tell a Story Across Quarters
The best QBRs connect to previous quarters and point toward future ones. Show the arc: "In Q2 we identified the problem, in Q3 we implemented the fix, in Q4 we saw the results." This narrative structure makes your QBR a chapter in an ongoing story rather than an isolated status update.
Focus on Action Items
A QBR without action items is a history lesson. Allocate at least 20% of your presentation time to forward-looking discussion. What will you do differently? What resources do you need? What are the measurable goals for next quarter?
Keep It Under 30 Slides
Ruthlessly cut anything that does not serve the conversation. If a slide exists only to show that you did work, move it to the appendix. Your audience's attention is finite — spend it on the slides that drive decisions.
Tailor to Your Audience
A QBR for your VP of Sales looks different from a QBR for a client's procurement team. Internal reviews can be more candid about failures. Client-facing QBRs should emphasize value delivered and ROI. SaaS customer success QBRs should highlight adoption metrics and expansion opportunities. Adjust your emphasis accordingly.
Rehearse the Transitions
The slides are just scaffolding. The real QBR happens in the transitions — how you move from the KPI dashboard to the wins section, how you pivot from challenges to action items. Practice these transitions so the presentation flows as a conversation, not a slide deck reading.
Common QBR Contexts Where AI Saves the Most Time
SaaS Customer Success QBRs
Account managers running 15-30 client QBRs per quarter benefit enormously from AI-assisted deck creation. Upload each client's usage data and let ChatSlide generate personalized QBR decks with adoption metrics, support ticket summaries, and renewal recommendations.
Sales Team Performance Reviews
Sales leaders reviewing team performance across territories, products, or segments can feed pipeline data into ChatSlide and get comparative visualizations in minutes instead of hours.
Internal Operations Reviews
Operations teams reporting on efficiency metrics, SLA compliance, and process improvements can upload operational data and generate decks with proper trend analysis and variance explanations.
Agency Client Reporting
Marketing and consulting agencies delivering quarterly results to clients can standardize their QBR format while personalizing the data for each account — scaling QBR quality without scaling headcount.
Start Building Your Next QBR
Your next quarterly business review does not need to take 12 hours. With ChatSlide, you can go from raw data and business context to a polished, chart-rich QBR presentation in a fraction of the time — then spend the hours you saved on the strategic thinking that actually moves the business forward.
Try ChatSlide for your next QBR — upload your data, describe your quarter, and let AI handle the slides while you focus on the story.