The Challenge: Teaching Statistics Is Mostly Slide-Building
If you teach a research methods or biostatistics course, the lecture itself is rarely the bottleneck — slide preparation is. A single 60-minute lecture on ANOVA needs an opening conceptual frame, the assumption checks, the F-distribution intuition, the decision tree for one-way vs. factorial vs. repeated-measures, a worked example with output, common pitfalls, and a recap. Doing that in PowerPoint by hand takes 4–6 hours per topic, and most of that time is layout work, not teaching.
The cost is felt most acutely by graduate-program instructors who teach research methods alongside their own research load — TAs trying to assemble lab handouts, post-docs covering a stats sequence, methods faculty who need to refresh course materials every semester. The math doesn't change, but the scaffolding around it has to.

This guide walks through using ChatSlide to draft an entire research-methods lecture deck — sampling, hypothesis testing, t-tests, ANOVA, MANOVA — in minutes, then refining it for your course audience.
What Makes a Strong Statistics Lecture Deck
A research-methods deck is a teaching artifact, not a slide showcase. The structure that works in classrooms maps roughly to:
- Opening conceptual frame. Why does this test exist? What problem in study design does it solve? Without the why, students memorize the formula and never reach for the right tool.
- Assumption checklist. Independence, normality, homogeneity of variance — written as a decision rule, not a paragraph. A flowchart slide here saves an entire lecture later.
- Hypothesis statements as templates. H₀ and H₁ in a fill-in form so students see the structure across tests, not as one-offs.
- One small worked example with the actual numbers. Two-sample comparison, three-group ANOVA, before-after repeated-measures — whatever the lecture is about, with the calculation step-by-step and the software output annotated.
- The interpretation slide. What does p < 0.05 mean here, what does it not mean, what is the effect size, is the conclusion practically meaningful.
- Common pitfalls. Multiple comparisons, post hoc fishing, peeking at the data, reporting just p-values. Students remember pitfalls better than they remember definitions.
- A clean recap. One slide. Three takeaways. The kind a student can screenshot the night before the exam.
ChatSlide's *Education|Lecture scenario is tuned for this rhythm — you give it the topic and the audience, and the outline lands close to the structure above by default.
Step-by-Step: Generate Your Stats Lecture in ChatSlide
1. Pick the right scenario and audience
When you start a project, choose Education > Lecture and write the audience as something concrete: "second-semester biostatistics students who have completed an intro probability course" or "clinical research coordinators learning to read trial output". The audience line is the single biggest lever on tone — abstract language for advanced classes, walk-the-numbers for applied ones.
2. Frame the topic by decision, not by name
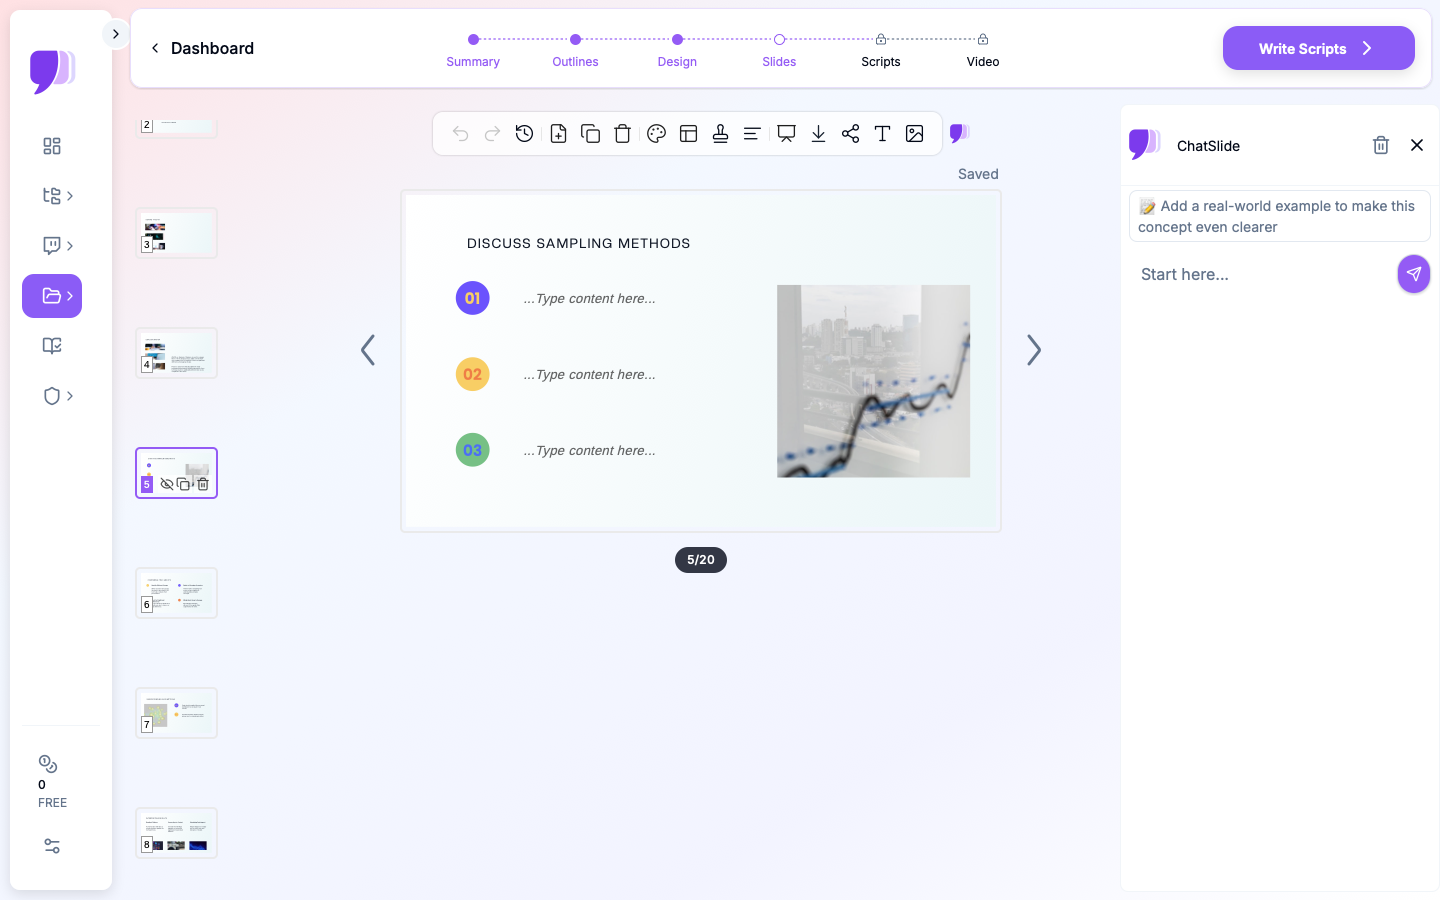
A topic of "ANOVA" produces a generic deck. A topic of "When to use one-way ANOVA versus a t-test versus repeated measures" produces a deck students can act on. The same goes for sampling: write "Probability sampling: when to use simple random, stratified, cluster, and systematic" rather than "Sampling methods".
This is also where the ChatSlide outline step earns its keep — you can adjust section count to 6 for a 50-minute slot or 8 for a 75-minute one, and tweak the subpoint count to control depth before any slides are rendered.
3. Let it draft, then re-architect
The first generation gives you a structurally complete deck — title, agenda, six sections, recap. Don't accept any slide as final. Walk through and:
- Promote the assumption checklist to a flowchart slide. Students need a visual decision rule, not a bullet list.
- Replace generic stock images on calculation slides with the actual formula or a small table. ChatSlide's editor lets you swap the image block for a text-only layout in two clicks.
- Add a worked-example slide between the theory and the recap. This is the slide students ask about in office hours.
4. Insert your own data
For applied statistics courses, the deck is dramatically more useful when the worked example uses data your students will see in lab. Upload your CSV via the project resources panel, ask ChatSlide to summarize it as a chart, then drop the chart onto your example slide. The chart updates if you change the underlying numbers — useful when you re-use the same lecture across semesters with different cohorts.
5. Layer in your speaker notes for live teaching
Speaker notes don't have to mirror the slide text. Use them for the questions you want to ask the class, the misconceptions you want to surface, and the transition phrasing between sections. ChatSlide preserves notes through PowerPoint export, so you keep them in presenter view when you teach.
6. Export for the LMS
Export to PowerPoint and PDF — the PDF is what you upload to Canvas/Blackboard for students; the PPTX is what you teach from. The deck stays editable for next semester's revision instead of being locked into a static PDF.
Tips for Research Methods Lecturers
- Build a deck library by test family. One deck per test (t-test, one-way ANOVA, factorial ANOVA, MANOVA, regression, chi-square) is more reusable than a single mega-deck — students can revisit just the unit they need.
- Use the same template across the course. Visual consistency cuts cognitive load. ChatSlide's design themes apply per-project; pick one and lock it.
- Cite the software output you'll use in lab. If your course uses R, show R output. If it uses SPSS, show SPSS. Decks that match the lab software stick.
- Plan the assessment slides separately. Sample exam questions belong in a study-guide deck, not the lecture itself. The lecture should leave students with intuition; the study guide tests it.
- Save your worked-example data with the deck. When the dataset lives in the project resources, the next instructor (or future-you) can rebuild the chart without hunting down the source CSV.
Get Started
ChatSlide handles the slide-building scaffolding so you can spend your time on the teaching that actually matters — choosing the right examples, anticipating misconceptions, refining the decision rules students will carry into their own research.
If you teach research methods, biostatistics, quantitative analysis, or experimental design, open ChatSlide and try drafting your next lecture deck from a topic line. Most instructors finish a six-section lecture in under thirty minutes — including the worked example.
For neighboring use cases, see our guides on journal club presentations, data-to-slides workflows for Excel, and research conference talks.